The decision your CFO can audit and your board can challenge isn't in the dashboard. It's in what the dashboard leaves out. We measure your sales organization and the process it runs, then put an economic profit number on every decision that follows. Not recommendations. Decisions.
Every engagement is built on the same instrument: the Productivity Ledger. How your managers run, how your comp lands, where your process burns selling hours, and what each of those is worth in economic profit.
Any tool can produce an analysis now. The scarce skill is knowing whether it's the right one, and asking the question nobody has asked yet. We bring it to every engagement.
Tested before told
Every finding has to beat the base rate. When one doesn't, you hear it first.
Built on your numbers
Your CRM, your plan, your history. Every model is built from data you already hold, and you keep it.
Small on purpose
Ten clients in two years. You work together with the partners all the way.
The Value Room in five ideas
Same forecast. Different risk. Different value.
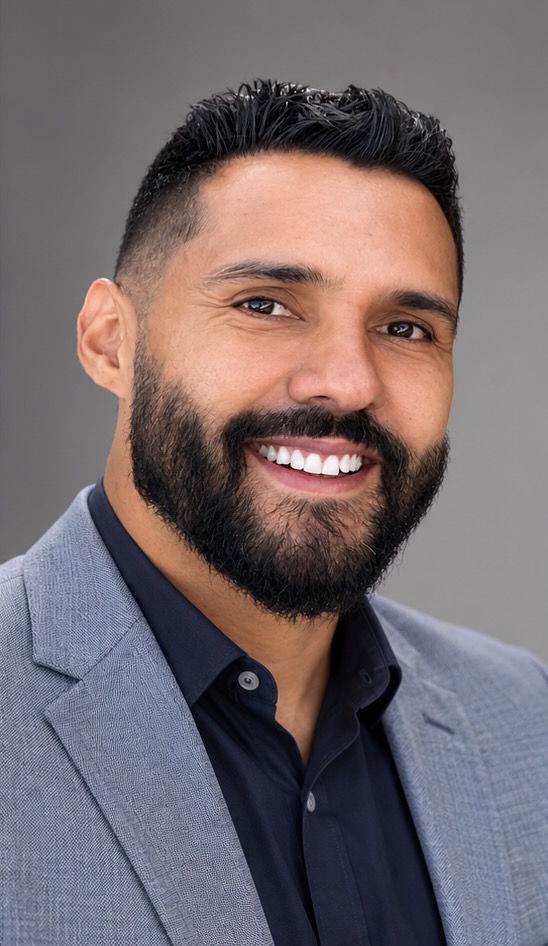
Gabriel Arbe Marroche
Rep A · 3 deals · $204,000 weighted pipelineRep B · 10 deals · $204,000 weighted pipeline
Your dashboard says these two reps are identical.
Ask any manager which one is in trouble. They will know in a second, and they will not be able to point at a number that says so.
That number is what we build.
The question you asked. The one underneath it.
Every engagement starts with one of these. None of them ends there.
You ask
What am I missing in my numbers?
Which of my metrics are outcomes I can only read after the fact, and which are levers I can still pull this quarter?
How do I sell more?
Which constraint is actually costing me the most and is it even in the sales organization?
Is my investment allocated where it should be?
What is each request worth as a priced option, rather than as a revenue promise?
We answer the second question. The first one answers itself once you can see the second.
Who it's for
Built for the sales organization. Around the person who owns the number.
Who we work for
Sales Leaders
You carry the number, and your forecast calls consume the capacity you are also being asked to grow. Your resources are fixed for the year while the market is not. You need the argument, not the spreadsheet.
The forecast call runs ninety minutes and changes nothing.
Who runs the data
Revenue Operations leaders
You own the CRM extract, the forecast process, and the analysis nobody else can run. The Read is built for the data you already have, and it takes about an hour of your analyst's time to produce.
You have more pipeline data than ever and still cannot say which constraint to remove.
Who has to be able to challenge it
CFOs and finance partners
Commercial requests reach you as revenue promises rather than comparable investment cases. Every number we produce is delivered with the method written out, so your team can rerun it and disagree with it.
The capacity you already pay for is consumed by work that is not selling.
What you get
Start with the free Read. If it finds economic profit worth more than the next engagement costs, we go deeper. If it does not, we say so plainly. You keep the two pages and the method either way.
Forecast and Capacity Read
No fee
You get what your forecast process costs in selling hours, and what recovering them is worth at your own win rate.
One CRM export. Two pages back: what your forecast judgment is worth, how many selling hours are trapped, and the method written out so your analyst can rerun it.
The Read opens the Process side of the Ledger. Managers, compensation, friction and experience are the Organization side, measured with the research instrument in the Diagnostic.
You stop guessing which constraint to remove first.
Your organization and processes measured and analyzed. All eight tests run. You get a decision queue ranked by economic profit, the model behind it, and an honest answer if the constraint sits elsewhere.
The number moves, and your team can keep moving it after we leave.
Five partner-days a month for working sessions, analysis and deliverables.
Between sessions you have us in writing, without limit and without a meter.
The Ledger runs on data your systems already hold, so it can sit where your team already works: a view in your CRM, a panel in the BI tool you already use, or a standalone application reading from both. We build it during the engagement, and it stays with you.
Every engagement is a fixed fee for a fixed scope. Both partners do the work. You keep every model we build.
What happens next
How it works
1 ·
You send one file
Forecast history, four quarters, from your CRM. About an hour of your analyst's time. IDs can be hashed.
2 ·
We tell you inside a day if it won't work
If the data cannot support the analysis we say so immediately. That answer is free too.
3 ·
Five business days
We run it. You get two pages and the method written out so your analyst can rerun it next quarter.
A benchmark tells you where you rank. It does not tell you what to change.
We did not survey what other companies do. We measured what actually moves a seller's output, on 228 of them, and we published the two things we expected to find and didn't.
Then we hand you the model and leave.
What we measure
The Productivity Ledger. Two layers, read together.
A dashboard reports what happened. A ledger records what each thing is worth, in one unit, so you can compare two of them and decide between them.
The Productivity Ledger has four accounts on each of two layers. Each account is measured, and each resolves into the same unit: economic profit. That is what lets you rank them against each other, and it is the difference between knowing which metric looks worst and knowing which constraint to remove first.
The Organization layer is measured with the instrument from our own research: the same six constructs, validated on 228 sellers and their front-line managers.
The Process layer is measured with the eight tests, which run on two extracts you already have: forecast history from the CRM and contract history from billing.
How first-line managers inspect, coach, and develop.
The strongest lever we measured. Tells you whether your management layer is producing capacity or consuming it.
Compensation design
Mechanics, perceived fairness, and whether it credits revenue the seller cannot cause.
Separates a plan that is expensive from a plan that is not believed.
Process friction
Approvals, deal desk, and internal meetings costed in selling hours.
Turns 'too many meetings' from a complaint into a number with a price on it.
People and experience
Tenure, ramp, attrition, and the experience base that predicts performance.
Tells you whether your next dollar belongs in hiring or in developing.
The process
What happens to the customer, stage by stage
The bowtie forecast
Volume, conversion, and time per stage after the close as rigorously as before it.
Prices the expansion option inside a closed deal that most forecasts carry at zero.
SaaS economics
NRR, GRR, CAC payback, Rule of 40, and value created by cohort.
Connects what the sales organization does to the numbers your board already tracks.
Pipeline management
Coverage derived from win rate, stage integrity, velocity, and tested judgment.
Tells you where inspection earns its hours and where it costs you them.
Capacity
Installed selling hours versus deployed hours, and what the gap is worth.
The account the other seven are eventually paid in.
Weak conversion does not automatically mean the team needs more activity.
A forecast is how you decide where the hours go.
Real options and economic profit, applied to the forecast your team already runs. Four measures added to it, computed from data your CRM already holds.
ARR, NRR, CLTV, gross churn, magic number, CAC payback. Every one is an aggregate outcome measured after the fact. None tells you which decision caused it.
Key drivers of sales productivity in a SaaS B2B sales force.
Our own primary study of 228 sample responses from salespeople and first-line sales managers at mid-to-large SaaS B2B technology companies. Six constructs, tested with confirmatory factor analysis and structural equation modeling, with bootstrapped mediation and moderated-mediation. Conducted by Gabriel Arbe Marroche as doctoral research at Florida International University, and the empirical base for everything we measure in a client engagement.
228
Sample
Salespeople and first-line managers at mid-to-large SaaS B2B firms.
Measurement model validated by confirmatory factor analysis; hypotheses tested with structural equation modeling.
What we asked
What actually drives sales productivity in a SaaS B2B sales force and which of those drivers a leader can manage? The model places salesperson motivation as the mediator between three antecedents: sales management control, compensation plan design, and internal bureaucracy. Customer success quality and sales enablement quality are tested as moderators.
What we found
01Management quality, compensation design and fairness, and internal bureaucratic friction shape a seller's motivational state. These are organizational choices, and a leader can change them.
02Motivation is necessary but not sufficient. Motivated sellers in a badly designed system still underproduce.
03Years of selling experience and organizational scale are among the strongest predictors of performance, reflecting human capital and structural advantage in complex solution selling.
04The strongest strategy pairs experienced-talent acquisition and scale-building with deliberate improvement of the motivational environment.
Build the management culture, design a compensation plan salespeople believe in, remove the friction that wastes their time, give them the tools and content they need and hire people who have done it before. That combination is what drives productivity in the SaaS B2B era.
Arbe Marroche, G. E. (2026). Key Drivers of Sales Productivity in a SaaS-Based Business-to-Business Software Sales Force. Doctoral dissertation, Florida International University. Summary available on request.
Who we are
Two partners. A research network behind them.
Gabriel Arbe Marroche
DBA, MBA, MSc, CPA
25+ years in enterprise software, sales, strategy, business intelligence and financial performance across the Americas, APJ and Europe, in roles that carried the number.
Mario Alguera
Black Belt CSSBB
15+ years in business operations, business intelligence and worldwide strategy development and implementation at HP, VMware and Databricks. He leads the change work ensuring adoption.
A separate research network of executives with regional-leadership and global commercial-operations backgrounds advises on extending the study. They participate out of their own interest, sit outside the commercial branch, and hold no economic interest in any engagement. The client work and the study behind it is done by the two partners.
Start here
Start with the Read
The honest way to find out whether this method has anything to say about your organization.